User Guide
QSO Predictor User Guide
Current as of Version 2.8.1
By Peter Hirst (WU2C)
📋 See README for What’s New, Version History, and Installation
Feature annotations in this guide (e.g. “v2.2.0”) indicate when a specific feature was introduced. All annotated features are available in the current release unless marked otherwise.
Table of Contents
- What is QSO Predictor?
- Installation
- Quick Start
- Understanding the Display
- Path Intelligence
- Local Intelligence
- Hunt Mode
- Path Prediction (IONIS)
- Fox/Hound & SuperFox Mode
- Workflows & Tips
- Settings
- Diagnostics & Full Checkup
- Audio Doctor (Windows)
- Troubleshooting
- FAQ
1. What is QSO Predictor?
The Problem
You’re calling a DX station. No response. Is the band dead? Is your signal too weak? Or are you buried under a pileup you can’t even hear?
Today’s tools show you the band from your perspective — who you’re decoding, who’s spotting you. They don’t show you what’s happening at the DX station’s end.
The Solution
QSO Predictor shows you the “view from the other end.” Using PSK Reporter data, it builds a picture of band conditions at the target’s location — what signals are arriving there, how crowded each frequency is, and whether your signal path is open.
The result: Fewer wasted calls, smarter frequency choices, better target selection.
QSO Predictor in Action
A real 40m FT8 QSO with V31DL (Belize, EK57) from Massachusetts (FN42), completed using QSO Predictor’s recommendations.
Step 1 — Target identified, all intelligence layers aligned
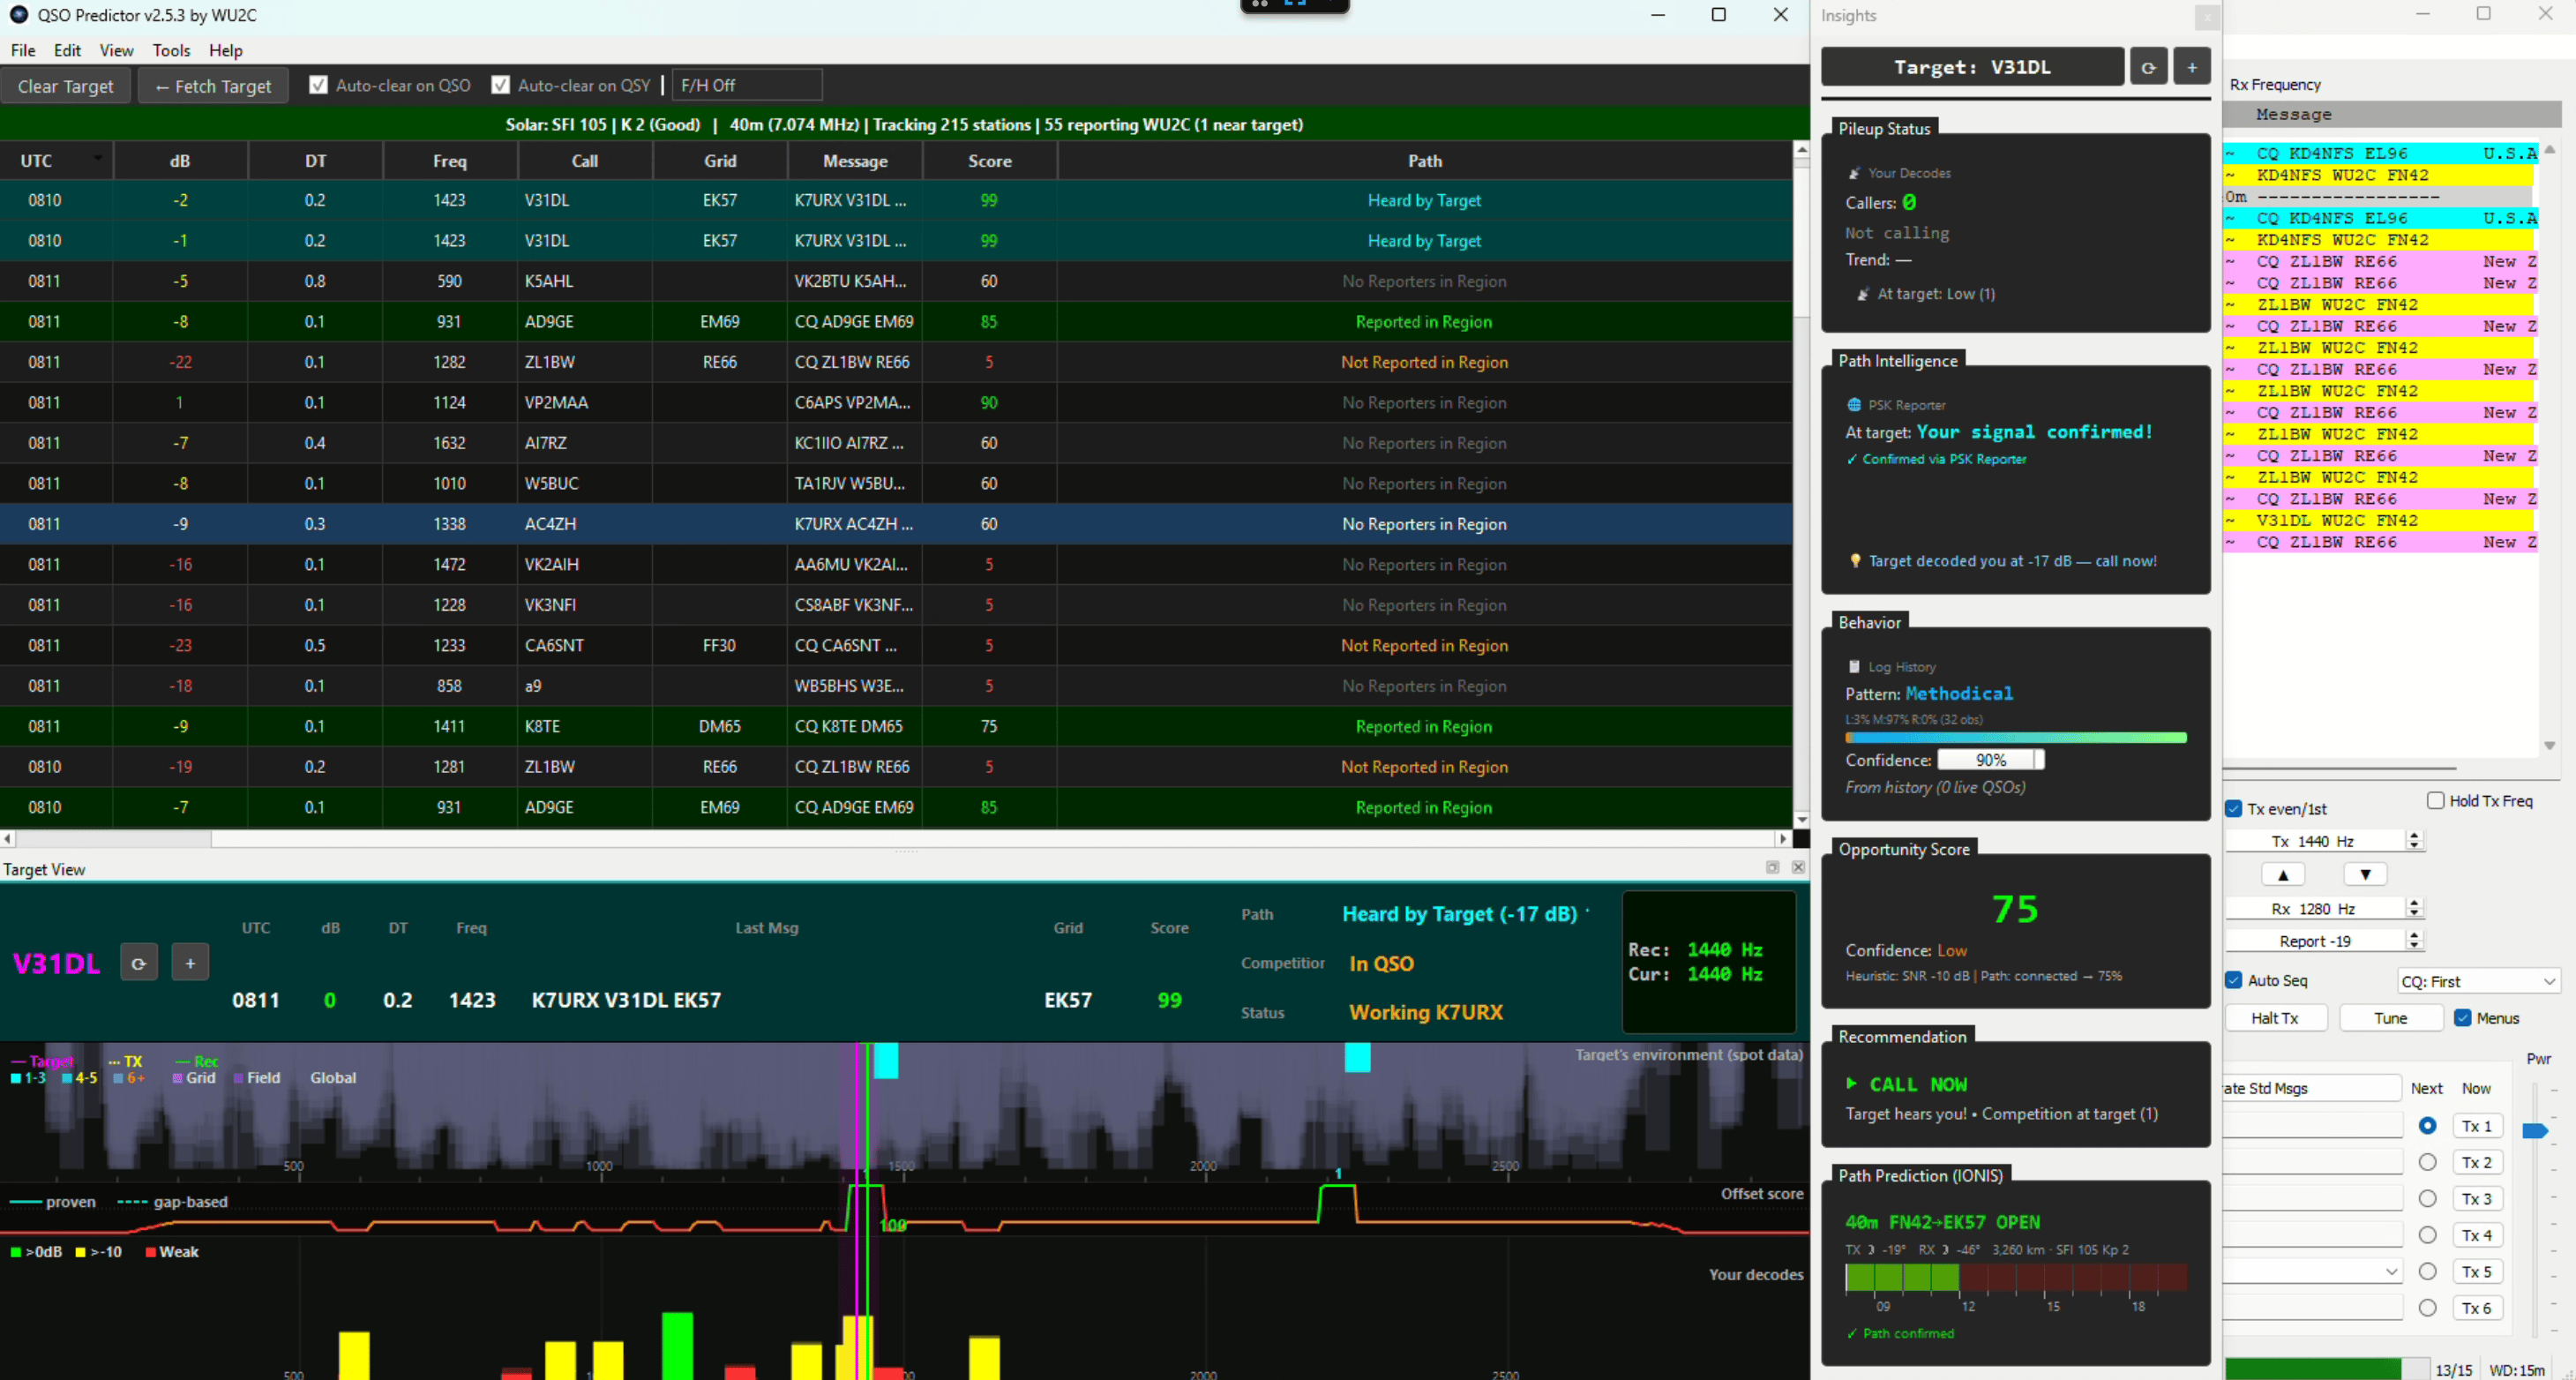
QSOP flagged V31DL with all four intelligence layers agreeing:
- Path Intelligence: Target decoded your signal at -17 dB — you’re in their receiver
- PSK Reporter: Path confirmed via regional reporters
- IONIS Propagation: 40m FN42→EK57 OPEN (3,280 km, SFI 105, Kp 2)
- Behavior: Methodical operator, 90% confidence from 32 prior observations
- Pileup: Low competition (1 competitor at target)
Recommendation: CALL NOW.
Step 2 — QSO confirmed
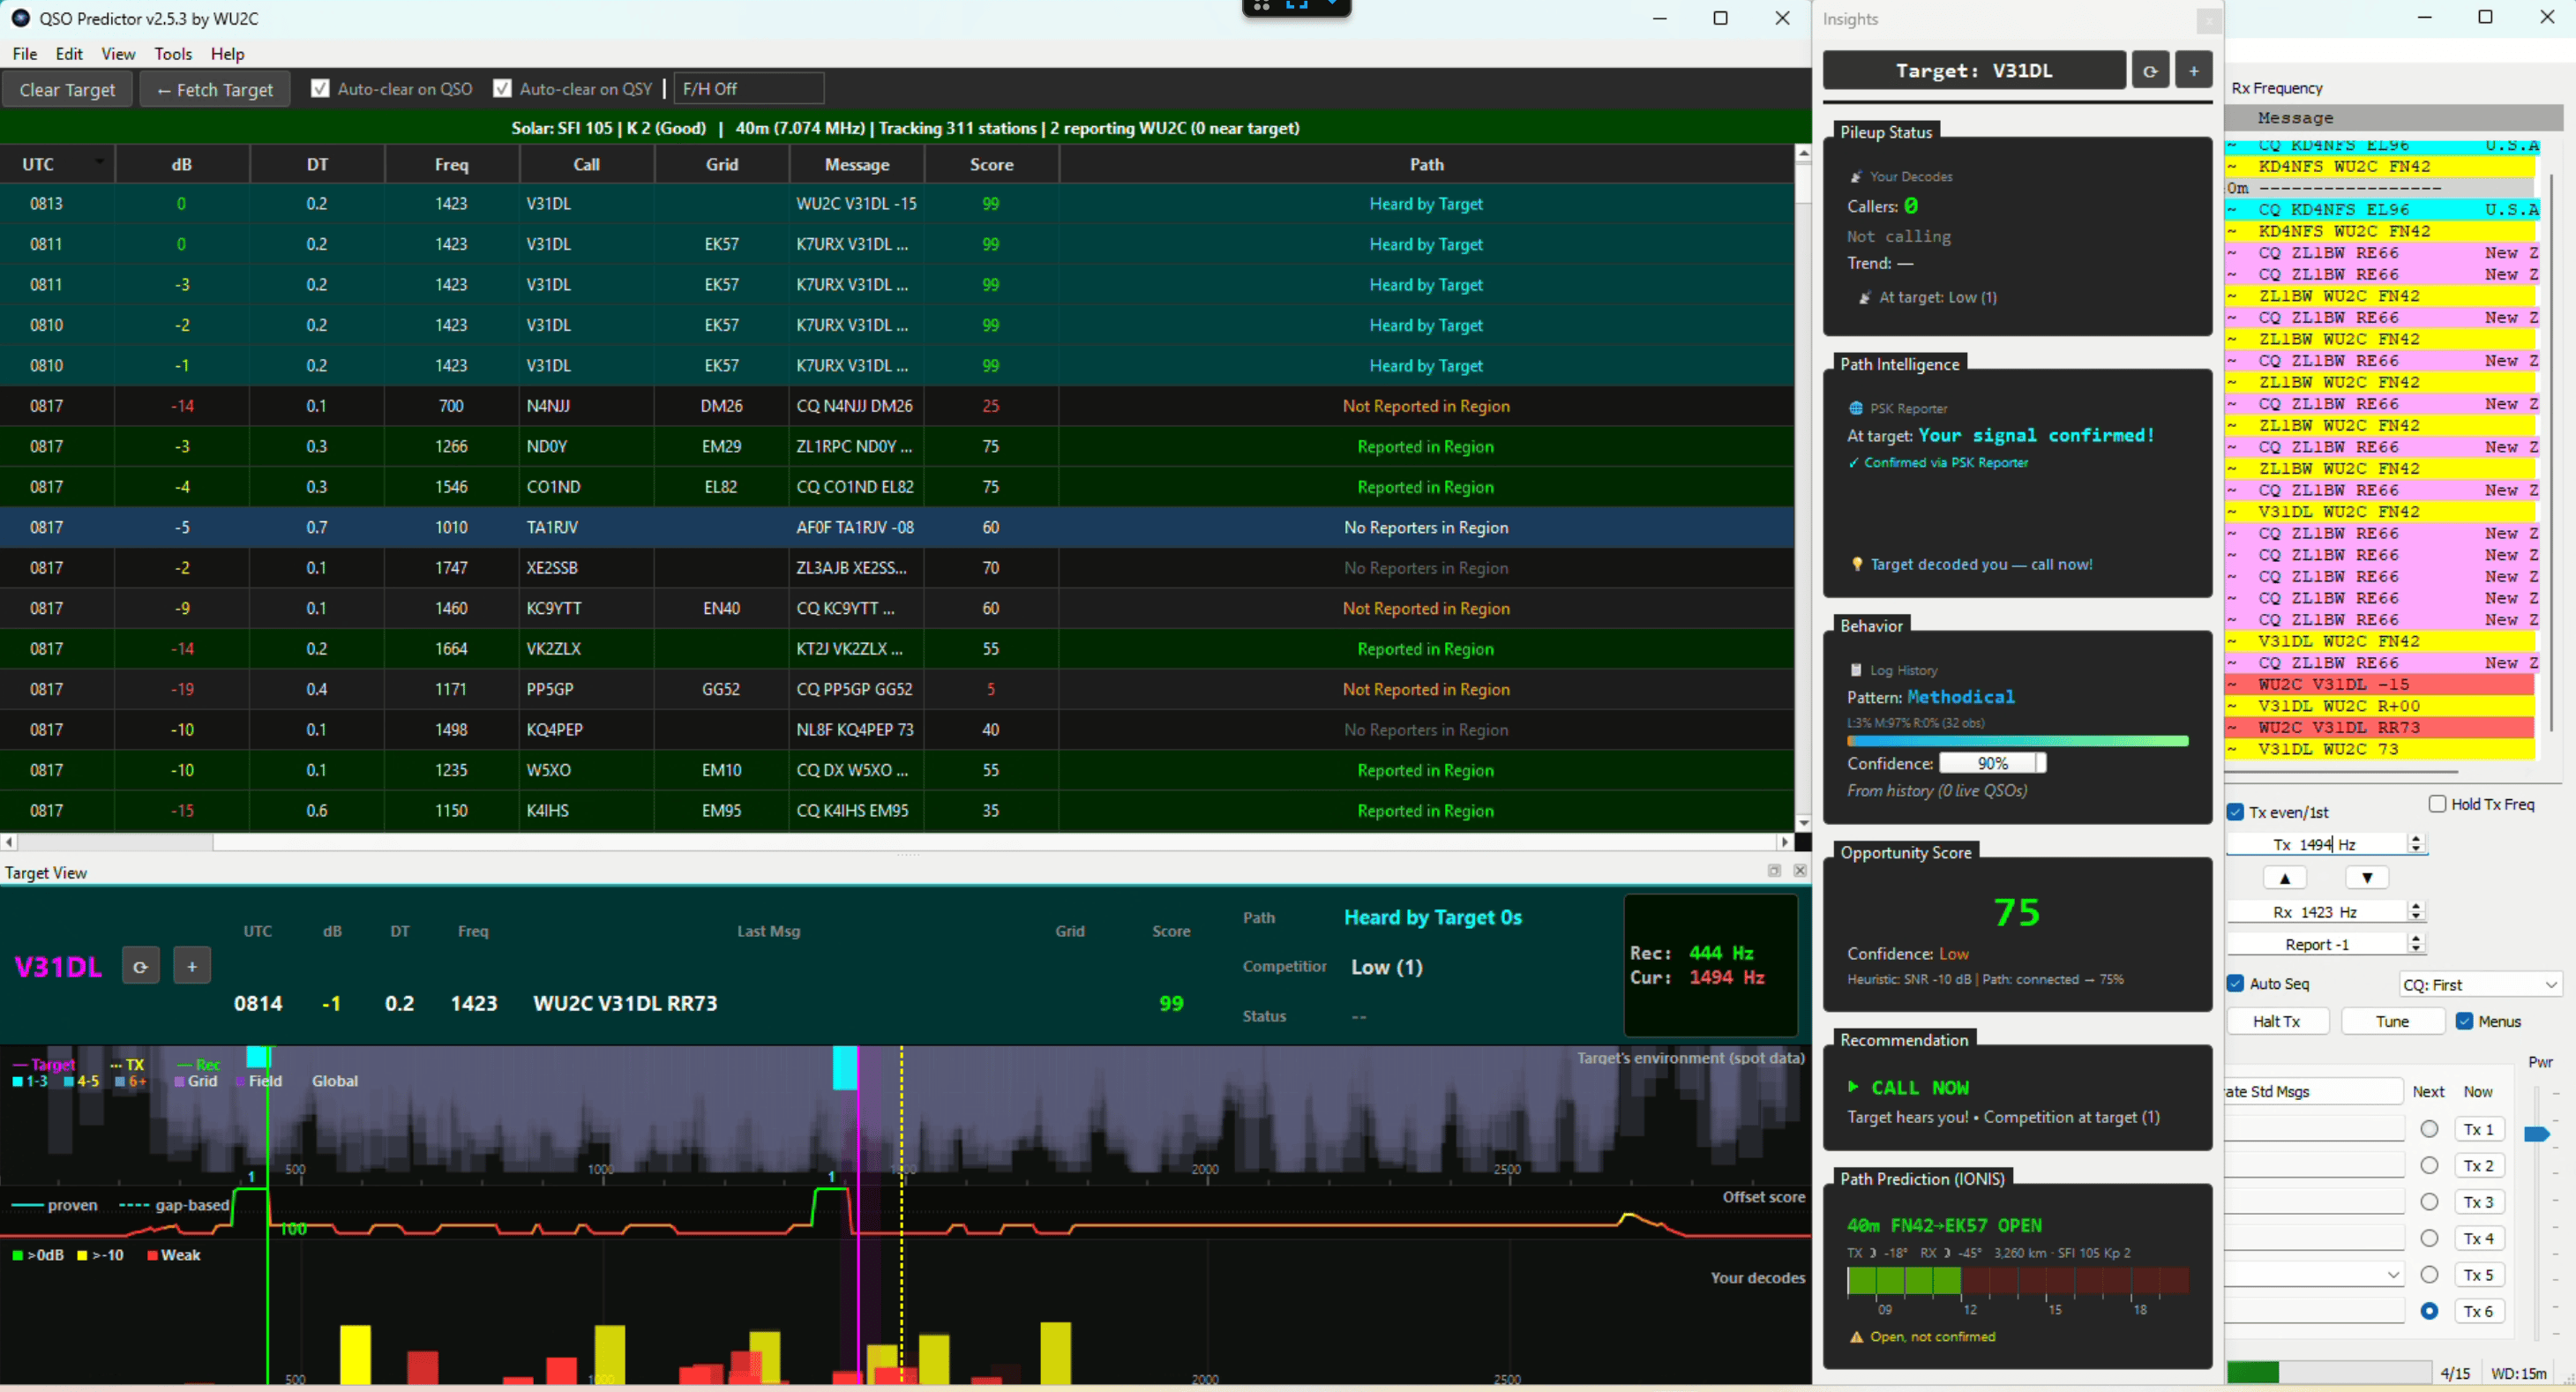
Clean four-message FT8 exchange with V31DL:
WU2C V31DL -15        ← V31DL replies with signal report
V31DL WU2C R+00       ← WU2C confirms with report back
WU2C V31DL RR73       ← V31DL seals the QSO
V31DL WU2C 73         ← WU2C final 73
Belize in the log. This is what “see the band from the DX station’s perspective” looks like in practice — intelligence that tells you when to call, not just what you’re hearing.
2. Installation
Windows
Option A (easiest) — Microsoft Store:
- Visit the QSO Predictor page on Microsoft Store
- Click Get (or Install)
- Launch from the Start menu once installed
The Store version is signed by Microsoft, auto-updates, and avoids any SmartScreen warnings. Requires Windows 10 version 1809 or later.
Option B — GitHub Release (for users who prefer direct download):
- Download the latest
.zipfrom GitHub Releases - Extract to any folder
- Run
QSO Predictor.exe - First run: Windows SmartScreen may warn about an unrecognized app
- Click “More info” → “Run anyway”
- This is normal for open-source software distributed outside the Store
Useful when the Store is blocked (some corporate networks), when you prefer not to use a Microsoft account, or for portable / offline installation.
Option C — Run from source (requires Python 3.10+)
git clone https://github.com/wu2c-peter/qso-predictor.git
cd qso-predictor
pip install -r requirements.txt
python main_v2.py
macOS
Option A (recommended): Install from DMG
- Download the latest
.dmgfrom GitHub Releases - Open the DMG and drag QSO Predictor to Applications
Option B: Run from source (requires Python 3.10+)
git clone https://github.com/wu2c-peter/qso-predictor.git
cd qso-predictor
pip install -r requirements.txt
python main_v2.py
Linux
No pre-built binary yet — run from source (requires Python 3.10+):
git clone https://github.com/wu2c-peter/qso-predictor.git
cd qso-predictor
pip install -r requirements.txt
python main_v2.py
Configure WSJT-X / JTDX
- Open Settings → Reporting
- Set UDP Server:
127.0.0.1 - Set Port:
2237(or2238if 2237 is in use) - Check “Accept UDP Requests”
Alternative: FT8web Browser Client (v2.5.8)
Instead of WSJT-X or JTDX, QSO Predictor can take its decodes, status, and logged-QSO data from FT8web — a browser-based FT8/FT4 client by Ondra, OK1CDJ. QSOP contributed the External Data Stream feature to FT8web upstream, so it works with the live site out of the box.
Use Chrome or Edge for FT8web. FT8web talks to your hardware through browser device APIs: Web Serial for CAT control of the rig, and media-device selection for the codec’s audio. Privacy-hardened browsers (DuckDuckGo, Brave with shields up) and Firefox/Safari block or lack these APIs — symptoms are a CAT port picker that fails with “access denied” and, subtler, FT8web silently capturing the wrong microphone after a reload: the waterfall moves but nothing ever decodes.
In QSO Predictor:
- Open File → Settings → Network tab
- In the FT8web Browser Client (Optional) group, check “Listen for FT8web data stream”
- Leave the WebSocket port at the default
2442unless another app already uses it
The listener is off by default.
Self-hosted FT8web (v2.8.1): the listener accepts WebSocket connections
only from pages served by ft8web.ok1cdj.com, localhost, or
127.0.0.1 (a browser stamps every connection with its page’s origin;
without this check any open web page could push decodes into QSOP and on
to your logger). If you run your own FT8web instance under another host
name, add it to a comma-separated allowed_origins key in the [FT8WEB]
section of qso_predictor.ini (see Config File Locations in the wiki).
The listener also raises a status-bar warning if it cannot open its port.
In FT8web:
- Open Settings → External Data Stream
- Set it to Enabled
- Set the URL to
ws://localhost:2442(match the port you set in QSOP)
Downstream apps keep working: a browser cannot send UDP, so FT8web by itself can’t feed GridTracker, JTAlert, or your logger. QSOP bridges that gap — everything received from FT8web is re-broadcast as standard WSJT-X UDP packets on the ports you’ve configured under UDP Forwarding (same Network tab), so your existing downstream apps continue to work unchanged.
Use one source at a time: run either WSJT-X/JTDX or FT8web as the active data source. While an FT8web client is connected, QSOP suppresses its usual “No data from WSJT-X/JTDX” warning — UDP silence is expected. If both sources are sending data at once, QSOP shows a “Two data sources active” warning in the status bar (see Troubleshooting).
3. Quick Start
First-Time Setup
- Launch QSO Predictor and wait for connection
- Set your callsign: File → Settings → My Callsign
- Set your grid: File → Settings → My Grid (4 or 6 char)
- Start WSJT-X/JTDX — decodes should appear automatically
Basic Workflow
- Select a target — click a row in the decode table (or double-click in WSJT-X)
- Read the band map — see what the target is hearing
- Check Path Intelligence — are others from your area getting through?
- Choose your frequency — find a clear spot at the target’s end
- Call!
4. Understanding the Display
The Band Map
The band map has three sections:
Top Section: Target Perspective
What the target station (and nearby stations) are hearing. Color-coded by geographic proximity:
| Color | Source | Meaning |
|---|---|---|
| Cyan | Target Station | Signals the target is actually decoding |
| Bright Blue | Same Grid | Stations in same 4-char grid hear these |
| Medium Blue | Same Field | Stations in same 2-char field hear these |
| Dark Blue | Global | Background activity (less relevant) |
Count numbers show signal density:
| Count | Meaning |
|---|---|
| 1-3 | Ideal — proven frequency, not saturated |
| 4-5 | Warning — getting crowded |
| 6+ | Crowded — decoder performance degrades |
Middle Section: Score Graph
Visual representation of the frequency recommendation algorithm:
| Score | Color | Meaning |
|---|---|---|
| 85-100 | Green | Excellent — proven with 1-3 signals at target |
| 65-84 | Cyan | Good — regional consensus quiet, or proven |
| 50-64 | Yellow | Moderate — limited data or light congestion |
| 25-49 | Orange | Poor — congested or suspicious gap |
| 0-24 | Red | Avoid — blocked, local QRM, or edge |
Line style:
- Solid line = Algorithm has tier 1 (proven) data
- Dotted line = Gap-based or regional scoring (less certain)
Score tooltips (v2.5): Hover over the score graph to see why any frequency has its current score. The tooltip shows the score, frequency, and a plain-English reason — for example “Proven: 2 signal(s) decoded by target” or “Regional quiet: 5 reporter(s) in area, clear” or “Suspicious gap: flanked by 6 target decodes”.
Regional consensus (v2.5): When multiple PSK Reporter stations near the target all show no activity at a frequency, confidence increases. The score scales continuously with reporter count — more independent reporters confirming quiet means a higher score. Frequencies flanked by heavy target activity but empty in between are flagged as suspicious (possible local QRM at target).
Sweep-aware recommendation (v2.8.1): When the Insights panel’s live pattern tracker sees the target working its pileup methodically from one end of the passband to the other (High → Low or Low → High, confidence 55% or better), the score curve is tilted by up to ±8% toward the end the target reaches first — so the green line leans toward where they will arrive next. It is a weight, not an override: a proven-ideal slot at the “wrong” end still beats a merely quiet slot at the favored end. The tilt clears when the target changes. Also since v2.8.1, when several quiet slots score identically the recommendation prefers the middle of the widest quiet stretch rather than simply the lowest frequency.
Bottom Section: Your Local Decodes
What your radio is receiving, color-coded by signal strength:
| Color | SNR | Meaning |
|---|---|---|
| Green | > 0 dB | Strong |
| Yellow | -10 to 0 dB | Medium |
| Red | < -10 dB | Weak |
The Overlay Lines
| Line | Color | Meaning |
|---|---|---|
| Target | Magenta | Target station’s TX frequency |
| TX | Yellow (dotted) | Your current TX frequency |
| Rec | Green | Recommended TX frequency |
The Path Column
The decode table’s Path column shows whether your signal is reaching each station’s area:
| Status | Color | Meaning |
|---|---|---|
| Heard by Target | Cyan | Target has decoded YOUR signal — call them! |
| Reported in Region | Green | Stations near target heard you — path confirmed |
| Not Reported in Region | Orange | Reporters exist but haven’t heard you yet |
| Not Transmitting | Gray | WSJT-X/JTDX reports you haven’t transmitted in the last few minutes (v2.8.1: no longer shown merely because you just changed bands) |
| No Reporters in Region | Dark gray | No PSK Reporter data from that area |
Target Activity State (v2.3.0)
The dashboard shows what the target station is doing right now, parsed from your local FT8 decodes:
| Status | Meaning |
|---|---|
| CQing | Target is calling CQ — open for contacts, call now |
| Working YOU | Target is in QSO with you — Fox is controlling TX |
| Working [call] | Target is in QSO with another station |
| In QSO (amber, v2.3.5) | Target is working/completing with another station — wait for them to finish |
| Idle | No target activity in last 2 minutes |
This is derived entirely from local decodes — no internet required. It updates in real time as the target’s transmissions are decoded.
In Fox/Hound mode: When “Working YOU” is detected during F/H operation, QSOP automatically disables click-to-set (since the Fox controls your TX frequency at that point) and shows “FOX CONTROLLING TX FREQUENCY” in the recommendation area.
Tactical Observation Toasts (v2.2.0)
A notification bar appears above the decode table with real-time tactical alerts:
| Alert | Style | Meaning |
|---|---|---|
| ⚠️ Hidden pileup | Orange | You see few callers locally but PSK Reporter shows heavy competition at the target’s end |
| 📈 Competition increasing | Orange | Caller count at target has jumped significantly |
| 📉 Competition dropping | Green | Pileup is thinning — opportunity window |
| 🎯 Target decoded YOU | Green | Your signal confirmed at target — call now! |
| 🟢 Path confirmed | Green | Propagation to target’s region is open |
| 🔴 Path lost | Orange | Path to target’s region no longer confirmed |
| 📡 Spotted near target | Green | You’ve been spotted near the target station |
Toasts auto-dismiss after 8 seconds, or click ✕ to dismiss immediately. Rate-limited to 1 per 15 seconds to avoid distraction.
Column Header Tooltips (v2.2.0)
Hover over any column header in the decode table to see what it means and where the data comes from. Particularly useful for Score and Path columns, which combine multiple data sources.
Click-to-Set Frequency
Click anywhere on the band map to manually set the recommended frequency:
- Green line jumps to your click position
- Dwells for 3 seconds (countdown shown)
- Then resumes auto-calculation
Use this to read off a specific frequency from the Rec display.
Click-to-Call (v2.8)
Double-click a callsign to set up the call in WSJT-X — no window switching, no helper scripts, all platforms:
- Decode table row, double-click — sets the station as your QSOP target and sends it to WSJT-X in one gesture.
- Target callsign (dashboard), double-click — sends the current target to WSJT-X.
- Single-click keeps its old meaning everywhere: a table row click sets the QSOP target only; a dashboard callsign click copies it to the clipboard (for pasting, or for auto-paste hotkey scripts).
What “sends to WSJT-X” means depends on what QSOP knows:
- Station CQ’d within the last ~45 seconds → QSOP sends a UDP Reply, and WSJT-X behaves exactly as if you double-clicked that decode in its own Band Activity window — including enabling TX if your WSJT-X “double-click on call sets Tx enable” option is on. (WSJT-X only accepts Reply for CQ/QRZ messages — the same limit JTAlert has.)
- Anyone else (working another station, stale CQ, manual target) → QSOP sends a UDP Configure: the DX Call and grid fields fill and standard messages generate, but you press Enable TX. QSOP never transmits beyond what WSJT-X’s own settings authorize.
The status bar confirms which happened: “replied to CQ” vs “DX Call set — press Enable TX”.
Requirements: “Accept UDP requests” checked in WSJT-X (you almost certainly have it — GridTracker needs it too), and QSOP must hear WSJT-X directly — multicast or direct unicast. On a forwarded stream (e.g. QSOP behind GridTracker’s forwarder) commands can’t reach WSJT-X; QSOP will say so in the status bar rather than fail silently.
The TX offset stays manual by design — there is no UDP message for it. Click the recommended frequency in QSOP to copy it, then paste it into WSJT-X’s Tx offset spinner (or let an auto-paste hotkey script do the typing; with click-to-call handling callsigns, such scripts only need to cover the offset).
WSJT-X vs JTDX (both verified live): WSJT-X — including the improved edition — supports both behaviors. JTDX supports replying to CQs but ignores the any-callsign Configure message (it forked before WSJT-X 2.3 introduced it). QSOP detects JTDX and falls back: the callsign is copied to the clipboard with a status-bar note, so one paste finishes the job.
Manual Target Entry (v2.4.5)
You can target any station by callsign, even if you haven’t decoded them:
- Click the + button next to the target callsign (in either the Target View dashboard or the Insights panel)
- Type the callsign and press Enter (or press Escape to cancel)
- QSOP sets the target and shows all available PSK Reporter intelligence
A ⚠ indicator next to the callsign shows the station hasn’t been decoded locally. Fields that require a local decode (UTC, dB, DT) show “–”. Everything from PSK Reporter works immediately: band map perspective, path intelligence, competition, and IONIS prediction.
When the station appears in your local decodes, the ⚠ clears automatically and full tactical mode engages.
Grid resolution: QSOP looks up the target’s grid from PSK Reporter data, local decode history, and a built-in DXCC prefix table. No API keys needed. If the grid isn’t found immediately, QSOP retries automatically as new data arrives.
Tip: Click the ⚠ callsign to copy it to clipboard — with the auto-paste script, this sends it directly to WSJT-X/JTDX’s DX Call field.
5. Path Intelligence
Path Intelligence answers: “Is anyone from my area getting through?”
Phase 1: Near-Me Detection
Shows stations from your geographic area that the target is hearing:
At target: 2 from your area heard
✓ Target uploads to PSK Reporter

📍 W2XYZ (FN31) → -12 dB @ 1847 Hz
🗺️ K2ABC (FN30) → -18 dB @ 1523 Hz

💡 Others getting through — you can too!
Icons:
- 📍 = Same grid square (very close)
- 🗺️ = Same field (regional)
Phase 2: Analyze Why
Click the 🔍 Analyze button to understand WHY nearby stations are succeeding:
Beaming Detection:
- Compares directional patterns between stations
- If one station is more concentrated than peers → likely beaming
Power Comparison:
- Compares SNR to peer stations
- If +6dB or more above peers → likely power/antenna advantage
Example insights:
- “📡 Likely beaming — 95% concentrated vs 70% peer avg”
- “⚡ +8dB above others nearby — likely power/antenna advantage”
- “📡 All 4 stations ~90% toward EU — likely propagation”
- “💡 Their freq has light traffic — try 1523 Hz?”
Interpreting Results
| Insight | What It Means | Can You Act? |
|---|---|---|
| Beaming detected | They have directional antenna toward target | Not easily |
| Power advantage | They’re running more power or better antenna | Maybe |
| All same direction | Propagation favors that path | Wait or try |
| Light traffic freq | Their frequency is relatively clear | Yes! Try it |
How Path Data Works Together (v2.2.0)
QSO Predictor uses three independent data sources for path information:
- PSK Reporter (my signal) — has any receiver near the target heard YOUR signal?
- PSK Reporter (target’s receivers) — is the target hearing stations from YOUR area?
- Local decodes — have you directly decoded a response from the target?
These can sometimes show different things. For example, the Path column might show “Not Reported in Region” (your signal not confirmed) while Path Intelligence shows 3 stations from your area getting through (the path IS viable).
v2.2.0 reconciliation: When near-me evidence exists but PSK Reporter hasn’t confirmed your specific signal, the strategy recommendation now accounts for both pieces of information — giving you “CALL NOW” instead of the old “TRY LATER” that ignored the evidence.
6. Local Intelligence
Local Intelligence predicts DX station behavior based on observed patterns.
Bootstrap (First-Time Setup)
- Go to Tools → Bootstrap Behavior
- Click Start Bootstrap
- Wait 10-30 seconds (analyzes last 14 days of logs)
- You’ll see: stations analyzed, persona distribution
Re-run bootstrap after major operating sessions to update profiles.
Behavior Prediction
The Insights Panel shows:
Pattern: How the target picks callers
- Loudest First — favors strong signals
- Methodical — works through pileup systematically
- Random/Fair — no clear preference
A detected sweep (High → Low / Low → High) also tilts the band map’s frequency recommendation toward where the target will arrive next (v2.8.1) — see Section 4, Score Graph.
Persona: Operating style classification
- Contest Op — high rate, picks loudest
- Casual Op — slower, more methodical
- DX Hunter — opportunistic
Confidence: How certain is the prediction
- High (>70%) — based on multiple observations
- Medium (40-70%) — limited data
- Low (<40%) — educated guess
Strategy Recommendations
Based on all available data — path intelligence, pileup state, target behavior, and propagation:
| Recommendation | Meaning |
|---|---|
| ▶ CALL NOW | Conditions favorable — call immediately |
| ▶ CALL (no intel) (v2.3.4) | Limited data available — no reason to wait, go ahead and call |
| ⏸ WAIT | Pileup too heavy, or unfavorable timing — hold off briefly |
| ⏭ TRY LATER | Path issues or target busy — come back in a few minutes |
Opportunity Score (v2.3.3)
The Insights panel shows an Opportunity Score (0–100) summarizing how favorable the current moment is for working the target. It blends:
- Path intelligence (is your signal reaching the target’s area?)
- Competition (how many callers are visible from the target’s perspective?)
- Target behavior prediction (how does this operator pick?)
- IONIS propagation (does the ionosphere support this path right now?)
The score is directional, not predictive — a high score means “this is a good moment to call” rather than “you will definitely make this QSO.” Use it as the headline read-out; the underlying components tell you why the moment is good or bad.
The Opportunity Score was previously labelled “Success Prediction” in versions before v2.3.3.
Pileup Contrast (v2.2.0)
The Insights panel shows target-side competition from PSK Reporter alongside your local decode count. This reveals hidden pileups — situations where your radio decodes no other callers but the target has heavy competition from stations you can’t decode.
The pileup status line shows your local situation unambiguously:
- “Calling — no other callers decoded” — your radio hasn’t decoded anyone else calling the target
- “Calling — 3 other callers decoded” — your radio sees 3 others
- “Calling — #1 loudest of 5 callers” — your SNR rank among decoded callers (useful for targets that pick loudest-first)
When a hidden pileup is detected, a yellow warning appears below:
- “⚠️ Hidden pileup — you can’t hear your competition!”
- Strategy recommendation adjusted to account for the real competition level
This is one of the most common reasons calls go unanswered — now you can see it happening.
7. Hunt Mode
Hunt Mode tracks specific stations you want to work.
Adding Targets
- Tools → Hunt List (or Ctrl+H)
- Click Add
- Enter callsign (and optionally band)
- Click OK
Alerts
When a hunt target is spotted:
- System tray notification pops up
- Status bar shows alert briefly
- Table row is highlighted (if visible)
Alert types:
- 📡 Active — target spotted on band
- 🎯 Working Nearby — target is working stations from your area!
Managing the List
- Edit — modify callsign or band
- Remove — delete from list
- Clear All — remove all targets
- List is saved between sessions
8. Path Prediction (IONIS)
QSO Predictor includes embedded HF propagation predictions powered by the IONIS model by Greg Beam (KI7MT). This feature appears as “Path Prediction (IONIS)” at the bottom of the Insights Panel.
What It Shows
When you select a target, the Path Prediction section displays:
Current Prediction: The band, path (your grid → target grid), and status:
- STRONG (bright green) — ionosphere is robustly supporting this path
- OPEN (green) — path is viable
- MARGINAL (yellow) — near the edge, could go either way
- CLOSED (red) — no ionospheric support for this path right now
Important: These statuses describe the ionosphere, not your specific signal. “STRONG” means even modest stations have a shot; “OPEN” means the path exists but you still need adequate power and antenna to close the link. Your station’s power and antenna are not modeled.
Solar Context: Sun elevation at each endpoint (☀ for daylight, ☽ for night) and path distance. This helps you understand why a path is open or closed — for example, high bands close when both endpoints are dark because the F-layer collapses.
12-Hour Forecast Strip: A color-coded bar showing how the path is expected to evolve. Each cell is one hour, colored from green (open) to red (closed). Tick marks appear every hour, with labels every 3 hours. The forecast is based on sun position (deterministic) and assumes current SFI/Kp hold constant.
vs-Reality Check: Compares the IONIS prediction against what PSK Reporter is actually observing for your specific path corridor (spots from your area arriving at the target’s area):
- ✓ Path confirmed by spots — stations from your area are being heard near the target
- ⚠ Predicted open, not confirmed — IONIS says the ionosphere supports the path but no spots from your area have been seen at the target
- ★ Better than expected — conditions are beating the prediction
- ★ Unexpected opening! — path is working when physics says it shouldn’t be (rare — act fast!)
- — Closed — both IONIS and PSK Reporter agree: no path
Conditions: The SFI and Kp values used for the prediction.
When It Updates
The prediction refreshes automatically when you:
- Select a new target — computes prediction for the new path
- Change bands — re-predicts for the new frequency
- Solar conditions refresh — re-predicts when SFI or Kp changes (every 15 minutes)
How It Works
IONIS is a neural network (205,621 parameters) trained on 20 million WSPR observations. It takes 17 input features — all derived from two grid squares, a frequency, the time, SFI, and Kp — and predicts whether the ionosphere can support a signal on this path. A deterministic physics override layer then clamps physically impossible predictions (e.g., 10m open when both endpoints are in deep night).
The model runs entirely locally with no internet connection required. It uses pure numpy (no PyTorch) and completes a prediction in about 0.1 milliseconds.
Enable / Disable
Go to Edit → Settings → Features and toggle “Enable IONIS propagation predictions.” Enabled by default. This setting is independent of Purist Mode — IONIS is local computation, not internet-dependent.
Tips
- The forecast strip is most useful for planning. If you see the path closing in 2 hours, prioritize this target now.
- “Unexpected opening!” is the money signal. When IONIS says closed but PSK Reporter shows spots from your area, conditions are unusually good. These windows tend to be short.
- “Predicted open, not confirmed” is normal. It means the ionosphere should support the path but PSK Reporter hasn’t seen spots from your area at the target yet. This could mean the path just opened, or that nobody from your area is transmitting on that band. It doesn’t mean the prediction is wrong.
- STRONG means even modest stations have a shot. If you see STRONG and you’re not getting through, the issue is likely at your end (power, antenna, noise floor) rather than the ionosphere.
- Watch for high Kp. The model accounts for geomagnetic storms, but Kp can spike suddenly. If Kp jumps, the forecast updates automatically on the next solar refresh.
- Low bands vs high bands are opposite. Low bands (40m, 80m) open at night when D-layer absorption vanishes. High bands (15m, 10m) need sunlit ionosphere for F-layer refraction. The forecast strip makes this visible.
9. Fox/Hound & SuperFox Mode
QSO Predictor is aware of Fox/Hound operating modes and adjusts its recommendations accordingly.
What Is Fox/Hound Mode?
Fox/Hound (F/H) is a special FT8 operating mode used by rare DXpeditions to handle high pileup rates. The DX station (Fox) transmits in a reserved low-frequency zone; calling stations (Hounds) transmit above it.
There are two variants:
| Mode | Fox transmits | Hounds transmit | Max simultaneous QSOs |
|---|---|---|---|
| F/H (old style) | 300–900 Hz | ≥1000 Hz | 5 |
| SuperFox | ~750–2262 Hz (1512 Hz wide) | ≥200 Hz (anywhere) | 9 |
SuperFox is used by major DXpeditions from 2024 onward (CY0S, TX5EU, etc.) and produces a visibly different wide signal on the waterfall.
Setting F/H Mode in QSOP
The toolbar has a three-state combo box:
| Setting | Use when |
|---|---|
| F/H Off | Normal FT8 operation |
| F/H | Old-style Fox/Hound |
| SuperF/H | SuperFox/SuperHound |
Auto-detection: QSOP detects F/H from two sources:
- WSJT-X UDP — when WSJT-X reports Hound mode via the special_mode field
- Manual selection — always available via the combo box
When UDP auto-detection fires, a disambiguation dialog appears asking you to confirm which mode you’re in — because WSJT-X cannot distinguish old-style Hound from SuperHound in UDP. Select F/H, SuperF/H, or Ignore.
Additionally, QSOP auto-detects SuperFox when “verified” or “$VERIFY$” appears in decoded messages — this upgrades F/H to SuperF/H automatically.
JTDX note: JTDX does not populate the UDP special mode field. For JTDX users, manual selection via the combo box is the reliable detection path.
What Changes in F/H Mode
Old-style F/H:
- Frequency recommendations clamped to ≥1000 Hz
- Fox zone (0–1000 Hz) dimmed red on band map with boundary marker
- Click-to-set below 1000 Hz is blocked
SuperF/H:
- No frequency clamping (Hounds may call anywhere ≥200 Hz)
- Fox zone overlay not shown (SuperFox occupies 750–2262 Hz)
Both modes:
- When Fox picks you up (“Working YOU” detected), click-to-set is fully disabled
- “FOX CONTROLLING TX FREQUENCY” replaces the green recommendation line
- Returns to normal when Fox moves to another station
Working a SuperFox DXpedition — Step by Step
SuperFox DXpeditions operate on non-standard frequencies — the 1512 Hz wide signal would obliterate normal FT8 traffic if transmitted on 14.074.
- Find the frequency — check the DXpedition’s website or DX cluster for their published FT8 frequency (e.g. CY0S on 20m uses 14.091 MHz, not 14.074)
- Tune your rig to that exact frequency — even 1 kHz off means no decodes
- Set RX audio offset to ~750 Hz in WSJT-X
- Set QSOP combo to SuperF/H
- Watch the waterfall — you’ll see a massive wide block of signal (1512 Hz wide), nothing like normal FT8
- Wait for a Fox decode to appear in WSJT-X Band Activity window — the SuperHound label turns green when verified
- Double-click the Fox decode line — WSJT-X starts transmitting automatically
- Do not touch Enable TX manually — it flashes momentarily if no Fox decoded yet, which is normal
- Let WSJT-X auto-sequence — once in QSO, it handles everything including sending your R+report and receiving RR73
- QSO logs automatically on RR73
WSJT-X SuperHound quirks: The TX frequency field is locked by WSJT-X — AHK scripts cannot set it. Decode window clicks do not send target-selection UDP packets. Set your target manually in QSOP when operating SuperHound.
Known Limitations
- WSJT-X UDP reports
special_mode=7for both old-style Hound AND SuperHound — there is no automatic distinction. The disambiguation dialog handles this. - JTDX always returns
special_mode=0— manual selection is required for JTDX users.
10. Workflows & Tips
Tactical Scenarios
Target is a “Contest Op”
Signs: Pattern shows “Loudest First”, high QSO rate
Your strategy:
- Maximize your signal strength
- Power and antenna matter most
- If you’re weak, wait for pileup to thin
Target is “Methodical”
Signs: Pattern shows “Methodical” or “Low → High”, steady rate
Your strategy:
- Be patient — they’ll get to you
- Persistence beats power
- Pick a spot and stay there
Heavy Pileup (7+ callers)
Signs: Many cyan bars, counts of 6+ at popular frequencies
Your strategy:
- Find frequencies with counts of 1-3 instead
- Consider waiting for pileup to thin
- Check Path Intelligence — do you have any advantage?
Hidden Pileup (v2.2.0)
Signs: Orange toast “Hidden pileup”, yellow warning in Insights panel showing “no other callers decoded” but target has high competition
What’s happening: You can’t decode the stations competing with you because propagation is one-way — they can reach the target but their signals don’t reach you. This is extremely common on long paths.
Your strategy:
- Don’t assume the band is clear just because your waterfall looks empty
- Trust the PSK Reporter data — the competition IS there
- Wait for the pileup to thin, or find a gap in the target’s perspective (cyan bars with low counts)
- Watch for the “📉 Competition dropping” toast — that’s your window
Pro Tips
- “Heard by Target” is gold — if Path shows this, call immediately
- Count numbers matter — frequencies showing 1-3 are ideal, 6+ means saturation
- Solid vs dotted — trust solid-line scores more than dotted
- Click to explore — click the band map to read specific frequencies
- Proven > Empty — a frequency where target IS decoding beats an empty gap
- Watch the pattern evolve — classification improves with each QSO you witness
- Use Path Intelligence — if others from your area are getting through, you can too
- Analyze before giving up — the Analyze button might reveal why others succeed
- Work one cycle ahead — select target early, let recommendation stabilize, enter frequency before next cycle starts
- Click to copy callsign — click the target callsign in either panel to copy to clipboard, then paste into WSJT-X/JTDX (or use the auto-paste scripts below)
- Watch the toast bar — tactical alerts appear above the decode table when conditions change. A green “target decoded YOU” toast means drop everything and call
- Don’t trust an empty waterfall — if the Insights panel shows a hidden pileup warning, there’s competition you can’t hear. Wait for the “competition dropping” toast
Windows Power Users: Auto-Paste to WSJT-X/JTDX
You can set up one-click transfer of frequencies and callsigns using AutoHotkey (free).
Changed in v2.8: Click-to-Call now sends callsigns to WSJT-X natively over UDP — the script’s WSJT-X callsign branch is disabled below so the two don’t double-drive the app. The script still earns its keep for:
- TX frequency (both apps) — there is no UDP message for the offset, so clipboard + paste remains the only automation;
- Callsigns on JTDX — JTDX ignores the UDP Configure message, so when you double-click a non-CQ station QSOP copies the callsign to the clipboard, and this script completes the paste automatically.
The workflow:
- Click band map → frequency auto-pastes to TX field (both apps)
- Double-click a station → QSOP calls WSJT-X directly; on JTDX the copied callsign auto-pastes to DX Call, generates messages, and clicks Enable TX (delete the Enable TX step if you prefer to press it yourself)
Quick setup:
- Install AutoHotkey v2.0 from https://www.autohotkey.com/
- Use Window Spy to find your field coordinates (Client x,y) for both:
- TX Freq field (the Hz offset box)
- DX Call field (the text box under “DX Call”)
- Create a file
QSOPredictor_AutoPaste.ahk:
#Requires AutoHotkey v2.0
; =============================================================
; QSO Predictor Auto-Paste Script
; Automatically pastes frequency OR callsign to WSJT-X/JTDX
; when you click the band map or target callsign in QSO Predictor
; =============================================================

; IMPORTANT: Update these coordinates using Window Spy!
; Hover over each field, note the CLIENT coordinates
;
; NOTE: Check JTDX first! JTDX's title bar contains "WSJT-X"
; so WinExist("WSJT-X") matches both apps.

; JTDX coordinates
JTDX_TX_X := 800     ; TX frequency field
JTDX_TX_Y := 630
JTDX_DX_X := 130     ; DX Call field (text box under "DX Call")
JTDX_DX_Y := 630
JTDX_GEN_X := 480    ; Generate Std Msgs button
JTDX_GEN_Y := 440
JTDX_ENTX_X := 480   ; Enable TX button
JTDX_ENTX_Y := 365

; WSJT-X coordinates
WSJTX_TX_X := 800    ; TX frequency field
WSJTX_TX_Y := 630
WSJTX_DX_X := 130    ; DX Call field
WSJTX_DX_Y := 630
WSJTX_GEN_X := 480   ; Generate Std Msgs button
WSJTX_GEN_Y := 440
WSJTX_ENTX_X := 480  ; Enable TX button
WSJTX_ENTX_Y := 365

; Monitor clipboard for changes
OnClipboardChange ClipboardChanged

ClipboardChanged(dataType)
{
    ; Only process text
    if dataType != 1
        return

    clip := Trim(A_Clipboard)
    if !clip
        return

    ; Frequency: 3-4 digits, 300-3000 Hz — no Enter needed, no Enable TX
    if RegExMatch(clip, "^\d{3,4}$") && clip >= 300 && clip <= 3000 {
        ; JTDX first — its title contains "WSJT-X" so must check first!
        if WinExist("JTDX")
            PasteToField("JTDX", JTDX_TX_X, JTDX_TX_Y, clip)
        else if WinExist("WSJT-X")
            PasteToField("WSJT-X", WSJTX_TX_X, WSJTX_TX_Y, clip)
        return
    }

    ; Callsign: 3-10 chars, has letter AND digit — Enter + Gen Msgs + Enable TX
    ; v2.8: WSJT-X branch disabled — QSOP click-to-call sends callsigns
    ; to WSJT-X over UDP; pasting too would double-drive it. JTDX stays
    ; active: JTDX ignores the UDP Configure message, so QSOP copies the
    ; callsign to the clipboard and this completes it.
    if RegExMatch(clip, "^[A-Z0-9/]{3,10}$") && RegExMatch(clip, "[A-Z]") && RegExMatch(clip, "\d") {
        if WinExist("JTDX")
            PasteCallsign("JTDX", JTDX_DX_X, JTDX_DX_Y, clip, JTDX_GEN_X, JTDX_GEN_Y, JTDX_ENTX_X, JTDX_ENTX_Y)
        ; else if WinExist("WSJT-X")
        ;     PasteCallsign("WSJT-X", WSJTX_DX_X, WSJTX_DX_Y, clip, WSJTX_GEN_X, WSJTX_GEN_Y, WSJTX_ENTX_X, WSJTX_ENTX_Y)
        return
    }
}

PasteToField(windowTitle, clickX, clickY, text)
{
    try {
        WinActivate windowTitle
        WinWaitActive windowTitle,, 2

        Click clickX, clickY
        Sleep 50

        Send "^a"
        Sleep 20
        Send text

        ; Confirmation tooltip
        ToolTip "TX Freq → " text
        SetTimer () => ToolTip(), -1500
    } catch {
        ToolTip "Could not paste to " windowTitle
        SetTimer () => ToolTip(), -2000
    }
}

PasteCallsign(windowTitle, dxX, dxY, text, genX, genY, enTxX, enTxY)
{
    try {
        WinActivate windowTitle
        WinWaitActive windowTitle,, 2

        ; 1. Click DX Call field and type callsign
        Click dxX, dxY
        Sleep 50
        Send "^a"
        Sleep 20
        Send text
        Send "{Enter}"

        ; 2. Click Generate Std Msgs to populate TX message sequence
        Sleep 100
        Click genX, genY

        ; 3. Click Enable TX to start calling
        if (enTxX > 0 && enTxY > 0) {
            Sleep 100
            Click enTxX, enTxY
        }

        ; Confirmation tooltip
        ToolTip "DX Call → " text
        SetTimer () => ToolTip(), -1500
    } catch {
        ToolTip "Could not paste to " windowTitle
        SetTimer () => ToolTip(), -2000
    }
}
- Double-click to run. Done!
Mac Power Users: Auto-Paste with Hammerspoon
- Install Hammerspoon from https://www.hammerspoon.org/
- Add to
~/.hammerspoon/init.lua:
-- =============================================================
-- QSO Predictor Auto-Paste Script (Hammerspoon)
-- Automatically pastes frequency OR callsign to WSJT-X/JTDX
-- when you click the band map or target callsign in QSO Predictor
-- =============================================================

-- UPDATE these coordinates using Hammerspoon console:
--   hs.mouse.absolutePosition()  (then subtract window origin)
--
-- NOTE: Check JTDX first! JTDX's title bar contains "WSJT-X"
-- so hs.application.find("WSJT-X") matches both apps.

-- JTDX coordinates
local JTDX_TX_X, JTDX_TX_Y = 800, 630       -- TX frequency field
local JTDX_DX_X, JTDX_DX_Y = 130, 630       -- DX Call field
local JTDX_GEN_X, JTDX_GEN_Y = 480, 440     -- Generate Std Msgs button
local JTDX_ENTX_X, JTDX_ENTX_Y = 480, 365   -- Enable TX button

-- WSJT-X coordinates
local WSJTX_TX_X, WSJTX_TX_Y = 800, 630      -- TX frequency field
local WSJTX_DX_X, WSJTX_DX_Y = 130, 630      -- DX Call field
local WSJTX_GEN_X, WSJTX_GEN_Y = 480, 440    -- Generate Std Msgs button
local WSJTX_ENTX_X, WSJTX_ENTX_Y = 480, 365  -- Enable TX button

local lastClip = ""

hs.timer.doEvery(0.5, function()
    local clip = hs.pasteboard.getContents()
    if not clip or clip == lastClip then return end
    lastClip = clip
    clip = clip:match("^%s*(.-)%s*$")  -- trim

    -- Frequency: 3-4 digits, 300-3000 — no Enter, no Enable TX
    if clip:match("^%d+$") and #clip >= 3 and #clip <= 4 then
        local freq = tonumber(clip)
        if freq >= 300 and freq <= 3000 then
            local app, x, y = findAppCoords("TX")
            if app then pasteToField(app, clip, x, y) end
            return
        end
    end

    -- Callsign: 3-10 chars, has letter AND digit — Enter + Gen Msgs + Enable TX
    -- v2.8: JTDX only — QSOP click-to-call sends callsigns to WSJT-X
    -- over UDP; pasting too would double-drive it. JTDX ignores the UDP
    -- Configure message, so QSOP copies the callsign and this completes it.
    if #clip >= 3 and #clip <= 10
       and clip:match("^[A-Z0-9/]+$")
       and clip:match("[A-Z]")
       and clip:match("%d") then
        local app, x, y, gx, gy, ex, ey = findAppCoords("DX")
        if app and app:name():find("JTDX") then
            pasteCallsign(app, clip, x, y, gx, gy, ex, ey)
        end
    end
end)

function findAppCoords(fieldType)
    -- JTDX first! Its title contains "WSJT-X" so must check first
    local app = hs.application.find("JTDX") or hs.application.find("WSJT-X")
    if not app then return nil end
    local name = app:name()
    local isJTDX = name:find("JTDX")
    if fieldType == "TX" then
        if isJTDX then return app, JTDX_TX_X, JTDX_TX_Y, 0, 0, 0, 0 end
        return app, WSJTX_TX_X, WSJTX_TX_Y, 0, 0, 0, 0
    else
        if isJTDX then return app, JTDX_DX_X, JTDX_DX_Y, JTDX_GEN_X, JTDX_GEN_Y, JTDX_ENTX_X, JTDX_ENTX_Y end
        return app, WSJTX_DX_X, WSJTX_DX_Y, WSJTX_GEN_X, WSJTX_GEN_Y, WSJTX_ENTX_X, WSJTX_ENTX_Y
    end
end

function pasteToField(app, text, x, y)
    app:activate()
    hs.timer.doAfter(0.3, function()
        local win = app:mainWindow()
        if not win then return end
        local frame = win:frame()
        hs.eventtap.leftClick({x = frame.x + x, y = frame.y + y})
        hs.timer.doAfter(0.1, function()
            hs.eventtap.keyStroke({"cmd"}, "a")
            hs.eventtap.keyStrokes(text)
            hs.alert.show("TX Freq → " .. text, 1.5)
        end)
    end)
end

function pasteCallsign(app, text, dxX, dxY, genX, genY, enTxX, enTxY)
    app:activate()
    hs.timer.doAfter(0.3, function()
        local win = app:mainWindow()
        if not win then return end
        local frame = win:frame()
        -- 1. Click DX Call field and type callsign
        hs.eventtap.leftClick({x = frame.x + dxX, y = frame.y + dxY})
        hs.timer.doAfter(0.1, function()
            hs.eventtap.keyStroke({"cmd"}, "a")
            hs.eventtap.keyStrokes(text)
            hs.eventtap.keyStroke({}, "return")
            -- 2. Click Generate Std Msgs to populate TX message sequence
            hs.timer.doAfter(0.1, function()
                hs.eventtap.leftClick({x = frame.x + genX, y = frame.y + genY})
                -- 3. Click Enable TX to start calling
                if enTxX > 0 and enTxY > 0 then
                    hs.timer.doAfter(0.1, function()
                        hs.eventtap.leftClick({x = frame.x + enTxX, y = frame.y + enTxY})
                    end)
                end
            end)
            hs.alert.show("DX Call → " .. text, 1.5)
        end)
    end)
end
- Reload Hammerspoon config (⌘+R in console).
Note: Both scripts check for JTDX first because JTDX’s title bar contains “WSJT-X” (it’s a fork). If you check WSJT-X first, it will match JTDX and use the wrong coordinates. You can also skip the scripts entirely and just Ctrl+V / ⌘+V manually.
📖 Finding coordinates: In AutoHotkey use Window Spy; in Hammerspoon use hs.mouse.absolutePosition() while hovering over each field. You need coordinates for: TX frequency field, DX Call field, Generate Std Msgs button, and Enable TX button.
Keyboard Shortcuts
| Key | Action |
|---|---|
| F1 | Open User Guide |
| F5 | Force refresh spots |
| Ctrl+R | Clear target selection |
| Ctrl+Y | Fetch target from WSJT-X/JTDX |
| Ctrl+H | Open Hunt List |
Click Actions
| Click | What happens |
|---|---|
| Click target callsign (either panel) | Copies callsign to clipboard |
| Click band map | Copies recommended frequency to clipboard |
| ⟳ button (either panel) | Fetches current target from WSJT-X/JTDX |
11. Settings
File → Settings
My Callsign: Your callsign (required for “who hears me” tracking)
My Grid: Your Maidenhead grid (4 or 6 char) — required for Path Intelligence
UDP Port: Default 2237. Change if another app uses that port.
Features tab (v2.4.0): Toggle optional subsystems:
- IONIS propagation predictions — enabled by default. Disable if you don’t want the Path Prediction panel.
- Outcome recording — enabled by default. See “Data Collection” below for what this is.
Appearance tab (v2.8.1): decode-table font family and size, and the two colours used for high/low probability in the Prob column and on the dashboard. Applied at the next launch.
Toolbar Options
A few commonly-used behaviors live on the main toolbar rather than in Settings:
- Auto-clear on QSO (v2.0.3) — when checked, QSOP clears the current target automatically after a QSO is logged (UDP Type 5). Useful for fast contest-style operating.
- Auto-clear on QSY (v2.1.0) — when checked, QSOP clears the target when you change bands. Prevents stale target state from surviving a band change.
- F/H mode combo — see Section 9 (Fox/Hound & SuperFox Mode).
Both auto-clear settings persist between sessions.
Network Configuration
Standard (single app):
UDP IP: 127.0.0.1
UDP Port: 2237
Multicast (with JTAlert, N3FJP):
UDP IP: 239.255.0.0
UDP Port: 2237
Choosing a group address: WSJT-X rejects multicast groups of the form
x.0.0.yorx.128.0.y(e.g.239.0.0.2) with the error “MAC-ambiguous multicast groups addresses not supported” — they collide with a reserved Ethernet address block.239.255.0.0is a safe choice. JTDX accepts these addresses, but use one WSJT-X would also accept so the same group works everywhere.
See Troubleshooting section for multi-app setups.
Data Collection (v2.5.1)
QSOP keeps a small amount of local data to support Local Intelligence and future self-evaluation features. Nothing is ever uploaded anywhere — all data stays on your machine.
Files in ~/.qso-predictor/ (Mac/Linux) or %USERPROFILE%\.qso-predictor\ (Windows):
| File | Purpose | Typical size |
|---|---|---|
behavior_history.json |
Observed picking behavior of stations you’ve seen | ~1 KB per station |
outcome_history.jsonl |
One compact record per QSO attempt — scoring context and outcome | ~380 bytes per event |
file_positions.json |
Bookkeeping for incremental log parsing | <1 KB |
Outcome recording specifics (v2.5.1): Each time you select a target, transmit, and then clear or complete the QSO, one event is written capturing QSOP’s ephemeral state at that moment — the recommendation you saw, the frequency you chose, path status, competition count, IONIS prediction, solar conditions, and the three-tier outcome (NO_RESPONSE, RESPONDED, QSO_LOGGED). No callsigns or grids are stored. Target distance and continent are stored but anonymized.
Schema v2 (v2.5.8): each record now also captures a tactical snapshot taken at target-select time (competition, pileup rank, SNR margins, behavior-model state, success probability, strategy) plus a compact per-TX-cycle trace — groundwork for the personalized recommendations planned for a future release. Older v1 records remain readable, and files containing a mix of v1 and v2 records are fine.
Why this exists: to enable Phase 2 self-evaluation and coaching features (planned for a future release) — “did following QSOP’s recommendation actually help?” is a question you can only answer with data.
To disable: Edit → Settings → Features → uncheck “Outcome recording”. The existing file is not deleted; future events are simply not written.
Growth is safe: ~3 MB/year for active operators. Automatic rotation at 50 MB.
Note: v2.5.3 includes a one-time cleanup of an older data file (
pending_observations.jsonl) that had been accumulating due to a bug in an unused training-pipeline stub. If you’re upgrading from an earlier v2.x, you may see a “Removed orphaned pending_observations.jsonl (X MB freed)” log message on first launch of v2.5.3. No user data is lost.
12. Diagnostics & Full Checkup
(v2.7.0) The Diagnostics menu holds a family of “doctors” — one per station subsystem — plus Run Full Checkup, which runs every doctor applicable to your platform and builds a single shareable report.
Why This Exists
Digital-mode stations are chains: configs, UDP links, serial ports, audio devices, the system clock, OS power management. When something silently breaks, the classic outcome is an evening lost to guessing — or a forum thread where helpers spend twenty replies asking for basic facts about your setup. A checkup collects those facts in seconds, passively (nothing is changed, no port is opened, nothing transmits), and turns them into findings.
The Report Is Made for Sharing
Every checkup ends in a markdown report you can Copy or Save. It is written for someone who cannot see your machine — paste it into a forum thread, an email to your club’s guru, or an AI assistant, and it carries its own context: findings first (worst first), then every check that passed, then what was not checked (so nobody assumes an unexamined subsystem is healthy), then the raw evidence tables.
Privacy: usernames are scrubbed from paths, and your callsign/grid are included only while the “Include station identity” checkbox is ticked — untick it for an anonymized report.
The Doctors
| Doctor | What it catches |
|---|---|
| Clock Doctor | The FT8 silent killer: a system clock more than ~1 s off UTC decodes nothing while everything looks fine. Measures your real offset against NTP (one 48-byte query) and checks timezone sanity. |
| Config Doctor | Duplicate config files where you edit the copy the app doesn’t read (modification times tell the story); configs whose stored audio devices no longer exist (the Windows USB-rename trap); missing callsigns. |
| Network Doctor | The UDP decode chain, verified link by link: who is configured to send where, and whether anything is actually listening there. Names the broken link (“GridTracker isn’t running, so nothing reaches QSO Predictor”). Unusual-but-consistent chains are recognized as healthy, not flagged. |
| Serial/CAT Doctor | Rig-control hardware: every serial port with its adapter chip identified (FTDI, CP210x, CH340, Prolific); configured CAT/PTT ports that don’t exist (the COM-renumber trap); the counterfeit-Prolific “Code 10” trap and FTDI-gate bricked cables; two apps fighting over one port. Strictly passive — it never opens a port, because opening one can key your transmitter. |
| System Doctor | OS-level traps: Windows Fast Startup (“Shut down” isn’t a reboot), USB selective suspend (the vanishing-mid-session USB device), automatic sleep ending unattended sessions, macOS microphone permission, Linux serial-group membership, and which ham apps do (or don’t) start automatically. |
| Audio Doctor (Windows) | The TX-audio path — see Section 13. |
Every doctor also runs from its own menu item, which is the cheap re-run loop after you fix something.
Reading the Results
Findings use the same severity chips as the Audio Doctor (✓ OK, ℹ Info, ? Unknown, ⚠ Warning, ✗ Problem). Two conventions worth knowing:
- “Unknown” means not examined — the doctor could not read that state (often a platform limitation), so verify it manually rather than assuming it’s fine. The report lists these under “Not checked”.
- Advisories are informational findings that still carry a concrete suggestion (e.g. “Fast Startup is ON — use Restart when troubleshooting hardware”). They are not problems, but the advice is shown in full.
13. Audio Doctor (Windows)
Diagnostics → Audio Doctor… (v2.6.0) diagnoses the Windows audio path between WSJT-X/JTDX and your rig. It exists because of one of digital modes’ most maddening failures: RX works fine, but your TX audio is silently dead — and nothing inside WSJT-X shows anything wrong.
Windows keeps per-app volume and mute state per device in the registry. It survives reboots, it’s invisible inside WSJT-X, and several everyday events can silence it: a browser using your microphone (communications ducking), a stray click in the Volume Mixer, or the codec re-enumerating after a USB port change. Audio Doctor checks all of these in seconds.
Audio Doctor is read-only. It changes nothing on your system — every finding tells you where to fix it, and most include a clickable link that opens the exact Windows settings page.
Windows only. The menu item does not appear on macOS or Linux — the failure modes it diagnoses live in the Windows audio stack. Packaged Windows installs include everything needed; if you run from source,
pip install -r requirements.txtinstalls the requiredpycawpackage (Windows only).
Opening It
Diagnostics → Audio Doctor… The dialog has two panels: a Configuration audit that runs automatically when the dialog opens (and again whenever you click Re-scan), and a Live TX path check you run on demand.
Reading the Configuration Audit
Eleven read-only checks, listed worst-first. Each carries a severity chip:
| Chip | Meaning |
|---|---|
| ✓ OK | Checked and healthy |
| ℹ Info | Worth knowing, not a fault |
| ? Unknown | Couldn’t read that setting — verify it manually |
| ⚠ Warning | Likely to cause trouble — fix when convenient |
| ✗ Problem | Actively breaking (or endangering) your TX audio — fix it |
What the checks catch, in plain English:
| Check | What it catches |
|---|---|
| Rig codec playback device | Is the rig’s audio codec present and active at all? Catches unplugged cables and disabled devices. |
| Duplicate / stale codec entries | The common USB codec chip has no serial number, so plugging it into a different USB port makes Windows treat it as a brand-new device (“2- USB Audio CODEC”) — and WSJT-X may still be bound to the old, dead entry. |
| Windows default playback device | The codec should not be the system default — otherwise every Windows ding and notification goes out over the air. |
| Windows default communication device | The codec shouldn’t hold this role either: a browser or VoIP call could transmit over the air, and it arms communications ducking against WSJT-X. |
| Communications ducking | Should be “Do nothing”. By default, Windows lowers other apps’ volume by 80% whenever any app opens a “communications” stream — a browser using your mic counts — and the lowered slider can stick. |
| TX (playback) format | The codec’s playback format. WSJT-X expects 48000 Hz; other rates force lossy resampling. Set “16 bit, 48000 Hz (DVD Quality)” in the codec’s Advanced properties. |
| RX (recording) format | Same check for the recording side. |
| Persisted Windows mixer state for WSJT-X/JTDX | The classic “RX works, TX dead”: a per-app mute or near-zero volume stored in the registry. It survives reboots, silences TX only, and shows nowhere inside WSJT-X. |
| Live WSJT-X/JTDX audio session | Where the app is actually playing audio right now, and whether that session is muted or turned down. |
| Other apps on the rig codec | Warns when another application (remote-desktop software, a browser, a media player) has an open audio stream on the rig codec — anything it plays can be transmitted. If FT8web is your active source, the browser is recognized as your TX app and not flagged. |
| System sounds | Warns when system sounds are enabled and the codec is the default device — the combination that puts dings on the air. |
(The Windows Fast Startup check moved to the System Doctor in v2.7.0 — run it from Diagnostics → System Doctor… or as part of a Full Checkup.)
The “Open …” Links
Most non-OK findings include a clickable link — “Open the volume mixer”, “Open the Communications tab”, “Open playback devices”, “Open recording devices”, “Open sound scheme settings”, “Open power options” — that jumps straight to the exact settings page. No hunting through Control Panel.
The Rig Device Name Box
The “Rig audio device name contains:” box at the top tells Audio Doctor which Windows device is your rig. The default, USB Audio CODEC, matches SignaLink, Digirig, and most rig-integrated codecs (IC-7300 and similar). It’s a simple substring match against Windows device names — if your interface is named differently, type any distinctive part of its name and click Re-scan.
Edits persist when you close the dialog with Close (pressing Escape discards them). The setting is also used by the automatic silent-TX monitor below.
The Live TX Path Check
The configuration audit finds stored problems; the live check catches your TX audio in the act:
- Press Tune in WSJT-X (or wait for a normal TX cycle) — the check needs a transmission in progress
- Click “Check TX path”
- Audio Doctor watches the Windows peak meters (the app’s audio session and the codec endpoint) for 4 seconds
- The verdict tells you which layer of the TX path is silent, if any:
| Verdict | What it means |
|---|---|
| “TX audio is reaching the codec” | Healthy. If the rig still shows no modulation, look at the rig side (USB MOD level, DATA mode). |
| “No WSJT-X audio session on the codec” | WSJT-X’s stored output-device binding is stale (usually after the codec re-enumerated). Fix inside WSJT-X: Settings → Audio → switch Output to another device, click OK, restart WSJT-X, then switch back and click OK. |
| “WSJT-X is muted in the Windows mixer” | The persistent per-app mute. Press Tune first, then open the Volume Mixer and unmute WSJT-X — a mixer opened before TX starts shows a stale, greyed row you can’t change. |
| “WSJT-X mixer volume is near zero” | Same store, volume variant — ducking or a stray click left the slider at the bottom. Press Tune first, then open the Volume Mixer and raise it to 100%. |
| “WSJT-X is not producing audio” | The session exists but is silent. Check the Pwr slider (bottom right in WSJT-X) and that a transmission is actually in progress. |
| “Audio is not reaching the codec” | WSJT-X is producing audio, but it’s going to a different device. Check WSJT-X Settings → Audio Output and the per-app output routing in the Volume mixer. |
| “Not enough data to judge the TX path” | The probe didn’t see enough samples. Press Tune and run the check again. |
Using FT8web? When the browser client is connected, the check automatically watches the browser’s audio session on the codec instead of WSJT-X’s — start a transmission in FT8web, then run the check. The verdicts and fixes adapt (no Tune button in a browser).
Trust this verdict over the Windows mixer page. The check reads the live audio session. Windows 11’s Settings → Sound → Volume mixer page can show an app’s slider greyed-out or at a wrong value even while that app is playing at healthy volume. See “Windows quirks worth knowing” below.
The Automatic Silent-TX Warning
You don’t have to remember to open Audio Doctor. Whenever WSJT-X reports it has started transmitting, QSOP quietly probes the TX path in the background for about 4 seconds (at most once per minute). If WSJT-X claims to be transmitting but no audio session or samples reach the codec, a sticky warning appears in the status bar:
⚠ TX audio: No WSJT-X audio session on the codec — see Diagnostics → Audio Doctor
The warning clears automatically on the next healthy transmission (or after 10 minutes). It stands down while an FT8web browser client is connected — in that setup the browser plays your TX audio, not wsjtx.exe, so a missing WSJT-X session is expected.
One quiet cycle never raises the warning (v2.8.0). The probe watches a single 4-second window at the start of a transmission, and a lone silent window is usually not a fault — a Halt TX click, a band change mid-cycle, a cut-short transmission. Since v2.8.0 a single silent probe is only logged; the warning appears after two consecutive silent probes. So if you see the banner at all, the TX path has now been silent twice in a row — and if it persists across further cycles, that’s the real “RX works but TX is silently dead” failure: Diagnostics → Audio Doctor will tell you which layer is silent. (A healthy transmission still clears it automatically.)
To disable the monitor, add this to qso_predictor.ini (in %APPDATA%\QSO Predictor\):
[AUDIO]
silent_tx_monitor = false
(The rig device name box saves to the same section, as rig_device_hint.)
Windows Quirks Worth Knowing
Even if you never hit a problem, these explain most “my TX audio vanished” mysteries:
- The Volume mixer page lies. Windows 11’s Settings → Sound → Volume mixer can show an app greyed-out or at the wrong value while the app is actively playing at healthy volume. Audio Doctor reads the live audio session — trust its verdict. To see the real value, press Tune first, then open the mixer.
- Mixer rows are only adjustable while the app is playing. To unmute or raise WSJT-X’s slider, press Tune first, then open the mixer — a mixer page opened before TX starts stays greyed even after TX begins (close and reopen it while still transmitting).
- A fresh mute can hide from the audit at first. Windows writes the persisted per-app store lazily, and the audit can only see a live session once WSJT-X has played audio since it started — so a mute set moments ago may not show in the audit until WSJT-X plays again. The live TX path check always catches it: press Tune and run it.
- Per-app volume is per device and permanent. It’s stored in the registry, survives reboots, silences TX only (RX is a separate path), and shows nowhere inside WSJT-X.
- Communications ducking is armed by browsers. Any app opening a “communications” stream — including a browser web-audio session using your mic — makes Windows drop other apps’ sliders by 80%, and the drop can stick after the call ends. Set ducking to “Do nothing”.
- The codec should hold neither Windows default role. Not default device (system sounds over the air), not default communication device (calls over the air, plus ducking armed against your TX audio).
- “Shut down” is not a reboot. With Fast Startup on (the Windows default), shutting down resumes a saved kernel image and does not reinitialize audio drivers. When troubleshooting audio, use Restart — a “power cycle” via Shut down proves nothing.
14. Troubleshooting
No Decodes Appearing
Check in order:
- WSJT-X/JTDX UDP settings:
- Settings → Reporting → UDP Server:
127.0.0.1 - Port:
2237 - “Accept UDP Requests” checked
- Settings → Reporting → UDP Server:
- Firewall:
- Allow UDP port 2237
- Add exception for QSO Predictor
- Port conflict:
- Another app using 2237?
- Try port 2238 in both apps
- Is WSJT-X actually decoding?
- Check its own display first
RX Works But TX Is Dead (Windows)
Decodes appear normally and the rig keys up on transmit, but no audio goes out — and everything inside WSJT-X looks correct.
This is almost always Windows-side per-app audio state: a persisted mixer mute, communications ducking after a browser call, or a stale device binding after a USB port change. Run Diagnostics → Audio Doctor (see Section 13) — press Tune in WSJT-X and click “Check TX path”, and it will tell you which layer of the TX path is silent in about 4 seconds.
Running with Multiple Apps
Problem: GridTracker, JTAlert, and QSO Predictor all need UDP data.
Solution 1: Multicast (recommended)
JTDX → 239.255.0.0:2237 → All apps receive
Configure all apps to use the same multicast address. (Avoid x.0.0.y
addresses like 239.0.0.2 — WSJT-X rejects them as “MAC-ambiguous”.)
Solution 2: Daisy-chain forwarding
JTDX → 2237 → GridTracker → 2238 → QSO Predictor
GridTracker receives on 2237 and forwards a copy to 2238 (its UDP forwarding option); QSO Predictor listens on 2238. QSOP can also be the middle hop — its UDP Forwarding setting re-emits to further ports.
Do not use JTDX’s “2nd UDP server” for this. That field sits under “Send logged QSO ADIF data” in JTDX’s Reporting tab — like WSJT-X’s Secondary UDP Server, it broadcasts logged-QSO records only, never the decode stream. An app pointed at it will see completed QSOs and nothing else. (Earlier versions of this guide suggested it — that advice was wrong.)
FT8web Data Source Warnings (v2.5.8)
Two status-bar behaviors change when the FT8web listener is enabled (see Section 2, “Alternative: FT8web Browser Client”):
“⚠ Two data sources active (WSJT-X/JTDX + FT8web)” — QSOP is receiving WSJT-X/JTDX UDP data and FT8web browser data at the same time. Running both interleaves conflicting dial-frequency and status information, which confuses the analysis — close one. The intended usage is one active data source at a time.
“No data from WSJT-X/JTDX” warning suppressed — while an FT8web browser client is connected, QSOP does not show its usual UDP-silence warning, because no UDP data is expected when the browser is your data source. Normal UDP monitoring resumes when the FT8web client disconnects.
PSK Reporter and Solar Warnings (v2.8.1)
The status bar now reports the live-feed problems that used to fail silently:
“⚠ PSK Reporter not connected — check internet / port 1883” — the MQTT broker could not be reached (no internet, a firewall on port 1883, or an outage). The band map’s target perspective stays empty until it reconnects; QSOP retries on its own with backoff.
“⚠ Connected to PSK Reporter but no spots yet” / “⚠ No MQTT spots for Ns” — connected, but the feed has gone quiet. Usually a PSK Reporter-side stall; it clears automatically when spots resume.
“Solar: unavailable” or “Solar: SFI 142 | K 2 (Good, 47 min old)” — the NOAA space-weather fetch failed. QSOP keeps showing the last good reading with its age rather than displaying zeros; IONIS uses typical conditions (SFI 100, Kp 2) until real data returns.
VPN Breaking Multicast (Multi-Computer Setups)
If you’re using multicast UDP across multiple computers and have VPN software installed:
Symptoms:
- Was working, suddenly stops
- No data received even though settings look correct
- MQTT connects fine but UDP shows “No messages received”
Why it happens:
- VPNs create a virtual network interface that intercepts traffic
- Multicast only works on local network — can’t route through VPN tunnels
- Even when VPN is “disconnected”, the software may still interfere
Solutions:
- Fully quit VPN software — don’t just disconnect, completely exit the app
- Restart QSO Predictor after quitting VPN
- Configure split tunneling — most VPNs let you exclude local network traffic or specific apps
- Whitelist local subnet — exclude
192.168.x.xor your local network range
Affected VPN software: Malwarebytes VPN, NordVPN, ExpressVPN, and most others.
Band Map Empty
- No target selected — click a station in decode table
- No perspective data — target area may have no PSK Reporter coverage
- MQTT not connected — check status bar for connection
Path Intelligence Shows “No Reporters in Region”
- Target’s area has no PSK Reporter stations uploading
- This is a data gap, not a problem with your setup
- Local Intelligence still works
Bootstrap Shows 0 Stations
- No log files found — check WSJT-X/JTDX has created ALL.TXT
- Log files too old — bootstrap looks at last 14 days
- Custom install path — only standard locations auto-detected
Windows SmartScreen Warning
This is normal for unsigned applications:
- Click “More info”
- Click “Run anyway”
High CPU Usage
- Heavy contest activity = more processing
- Try restarting application
- Check if stuck in a loop
Clearing Data
Reset behavior history (forces re-bootstrap):
del "%USERPROFILE%\.qso-predictor\behavior_history.json"
Delete outcome recording history (safe — nothing upstream depends on it):
del "%USERPROFILE%\.qso-predictor\outcome_history.jsonl"
Full reset (removes all local data — behavior, outcomes, cached file positions):
rmdir /s /q "%USERPROFILE%\.qso-predictor"
Disk space concern? If you’re running a version of QSOP from before v2.5.3 and see a pending_observations.jsonl file that’s unusually large (potentially hundreds of GB due to a fixed bug), just upgrade to v2.5.3 or later — the file is removed automatically on first launch. See Release Notes for v2.5.3 for details.
SuperFox — Enable TX Flashes But Won’t Transmit
WSJT-X prevents transmitting in SuperHound mode until you have decoded the Fox. Enable TX flashing momentarily then returning to white means no Fox decode has been received yet.
Check:
- Is your rig on the DXpedition’s exact published frequency (not 14.074)?
- Is the RX audio offset set to ~750 Hz?
- Can you see a wide block signal on the waterfall? If not, the Fox may not be transmitting on your current band or the path may be closed.
- Once a Fox decode appears in the Band Activity window, double-click it — WSJT-X will then enable TX.
SuperFox — Clicking Decodes Does Nothing
In SuperHound mode, WSJT-X suppresses decode window clicks and does not send target-selection UDP packets. This is intentional WSJT-X behaviour. Set your target manually in QSOP’s target field.
15. FAQ
Q: Does QSO Predictor transmit for me?
A: No. It’s advisory only. You control your radio through WSJT-X/JTDX.
Q: Does it work with other modes (CW, SSB)?
A: Currently FT8/FT4 only. The algorithms are designed for these modes.
Q: Can I use it without internet?
A: Partially. Local Intelligence works offline. Target Perspective requires PSK Reporter (internet).
Q: Does it work on Mac/Linux?
A: Yes — Windows (.exe) and macOS (.dmg) builds are available on the Releases page. Linux users should run from Python source.
Q: Is my data uploaded anywhere?
A: No. QSO Predictor only downloads PSK Reporter data. Your logs and behavior history stay local. See the Privacy Policy for details.
Q: Why does bootstrap take 30 seconds?
A: It’s parsing up to 500,000 decodes from your log files. This is a one-time operation.
Q: What if the target isn’t uploading to PSK Reporter?
A: You’ll get Tier 2/3 proxy data from nearby stations. Sometimes you just have to call and see.
Q: How accurate is beaming detection?
A: It compares your target to peer stations. Works best with 3+ peers. Can’t distinguish “everyone beaming same direction” from “propagation favors that direction.”
Q: Why do I see “Similar pattern to nearby stations”?
A: All near-me stations show the same directional pattern. This is normal — it’s likely propagation, not antenna differences.
Q: What is SuperFox mode and how is it different from Fox/Hound?
A: SuperFox is an enhanced DXpedition mode introduced in WSJT-X 2.7.0. Instead of up to 5 simultaneous narrow FT8 signals, the Fox transmits a single 1512 Hz wide constant-envelope signal that can work up to 9 Hounds simultaneously with no signal-strength penalty. It also includes a digital signature that WSJT-X verifies to confirm the Fox is a legitimate DXpedition. Most major DXpeditions from 2024 onward use SuperFox.
Q: Why can’t I click on decodes in WSJT-X when in SuperHound mode?
A: WSJT-X intentionally suppresses decode window interaction in SuperHound mode — the protocol is almost fully automated. Double-click only works on the Fox’s own decode line, which triggers WSJT-X to start calling. All other clicks are blocked.
Q: Why won’t Enable TX stay on in SuperHound mode?
A: WSJT-X prevents blind calling in SuperHound mode to keep the bands clean. You must first receive and decode a transmission from the Fox, then double-click that decode. Enable TX will then latch on properly.
Q: The SuperFox is on 14.091 but I’m tuned to 14.074 — why does this matter?
A: SuperFox stations must use non-standard frequencies because their 1512 Hz wide signal would obliterate all normal FT8 traffic if transmitted on 14.074. Always check the DXpedition’s published frequency on their website or the DX cluster before trying to work them on FT8.
Q: How do I know if a DXpedition is using SuperFox or old-style Fox/Hound?
A: Check their website — it will be stated explicitly. Visual clues: SuperFox produces a wide block signal on the waterfall; old-style Fox produces narrow multiple streams. In WSJT-X, the SuperHound label turns green when the Fox signal is verified (old-style Hound shows red).
Q: What is a “hidden pileup”?
A: When you see few or no callers on your waterfall but PSK Reporter shows heavy competition at the target’s location. This happens because propagation is often asymmetric — stations from other regions can reach the target but their signals don’t reach you. The v2.2.0 pileup contrast feature detects this and warns you.
Q: Why does the Path column show “Not Heard” but the recommendation says “CALL NOW”?
A: v2.2.0 uses “effective path status” — if Path Intelligence shows stations from your area getting through (even though YOUR specific signal hasn’t been confirmed), the recommendation accounts for that evidence. The Path column still shows the factual status of your signal, while the recommendation considers the broader picture.
Q: A “⚠ TX audio: WSJT-X is not producing audio” warning appeared in the status bar. Is something wrong?
A: Worth a look — since v2.8.0 that warning means two consecutive transmissions measured silent, not one. (A single quiet cycle — Halt TX, a mid-cycle band change, a cut-short transmission — no longer raises it at all; it’s just logged while the monitor waits for a second probe to confirm.) A healthy transmission still clears the warning automatically. If it persists across further TX cycles, run Diagnostics → Audio Doctor to find which layer of the TX path is silent.
Getting Help
- GitHub Issues: Report bugs or request features
- GitHub Discussions: Ask questions, share tips
- Privacy Policy: PRIVACY.md
73 de WU2C